
Widgets with their own data
Each widget on a dashboard, and each map, chart or table in a document, can now have its own data. On a dashboard about Montréal's rental market, you can show the 2015 average rent on one map and keep the 2025 map beside it, without adding a page to the project.
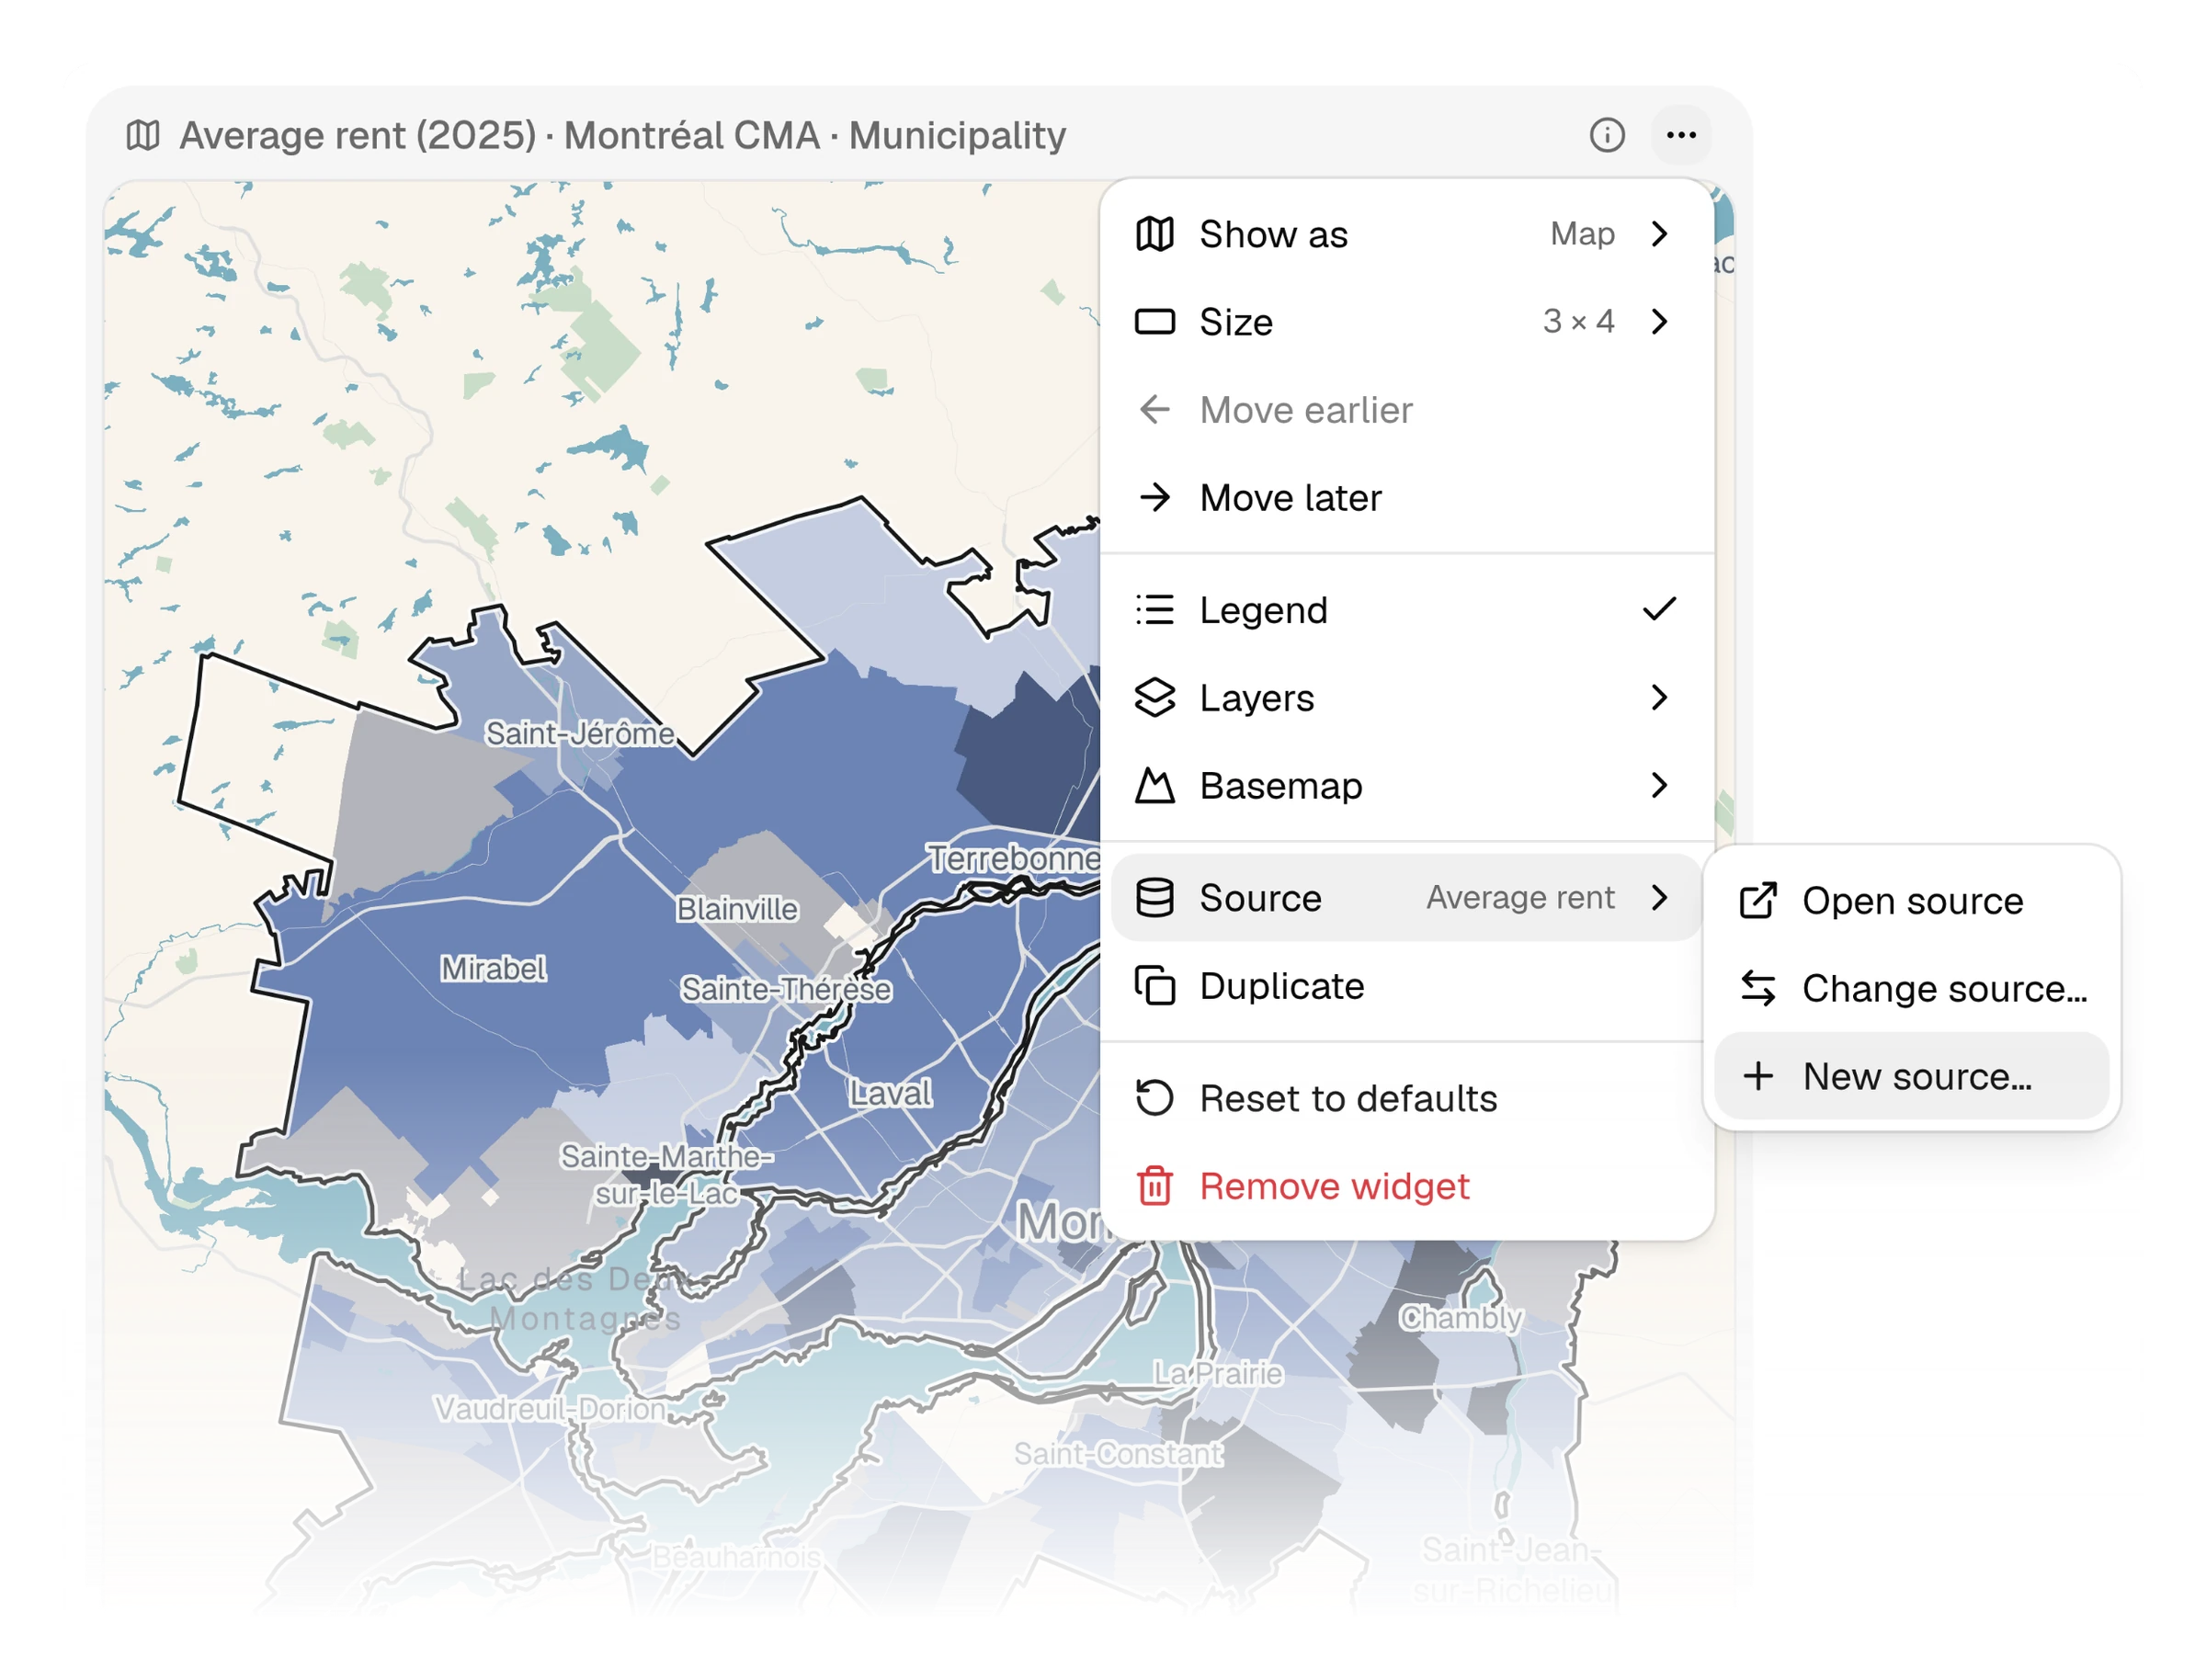
Give a widget its own data
Open a widget's ⋯ menu, hover over "Source" and choose "New source…". The indicator, comparison, region and scale controls open on a copy of the page's data. Change what you need, such as the year, then click "Create". "Source" now reads "Inline". From then on, "Edit data…" changes that widget's data and nothing else. When you add a widget, "New indicator" at the bottom of the page list sets up its own data the same way. A document's picker offers it too. A widget's own data doesn't count toward your plan's page limit. If other widgets need it, "Turn into page" adds it to the project's tabs.
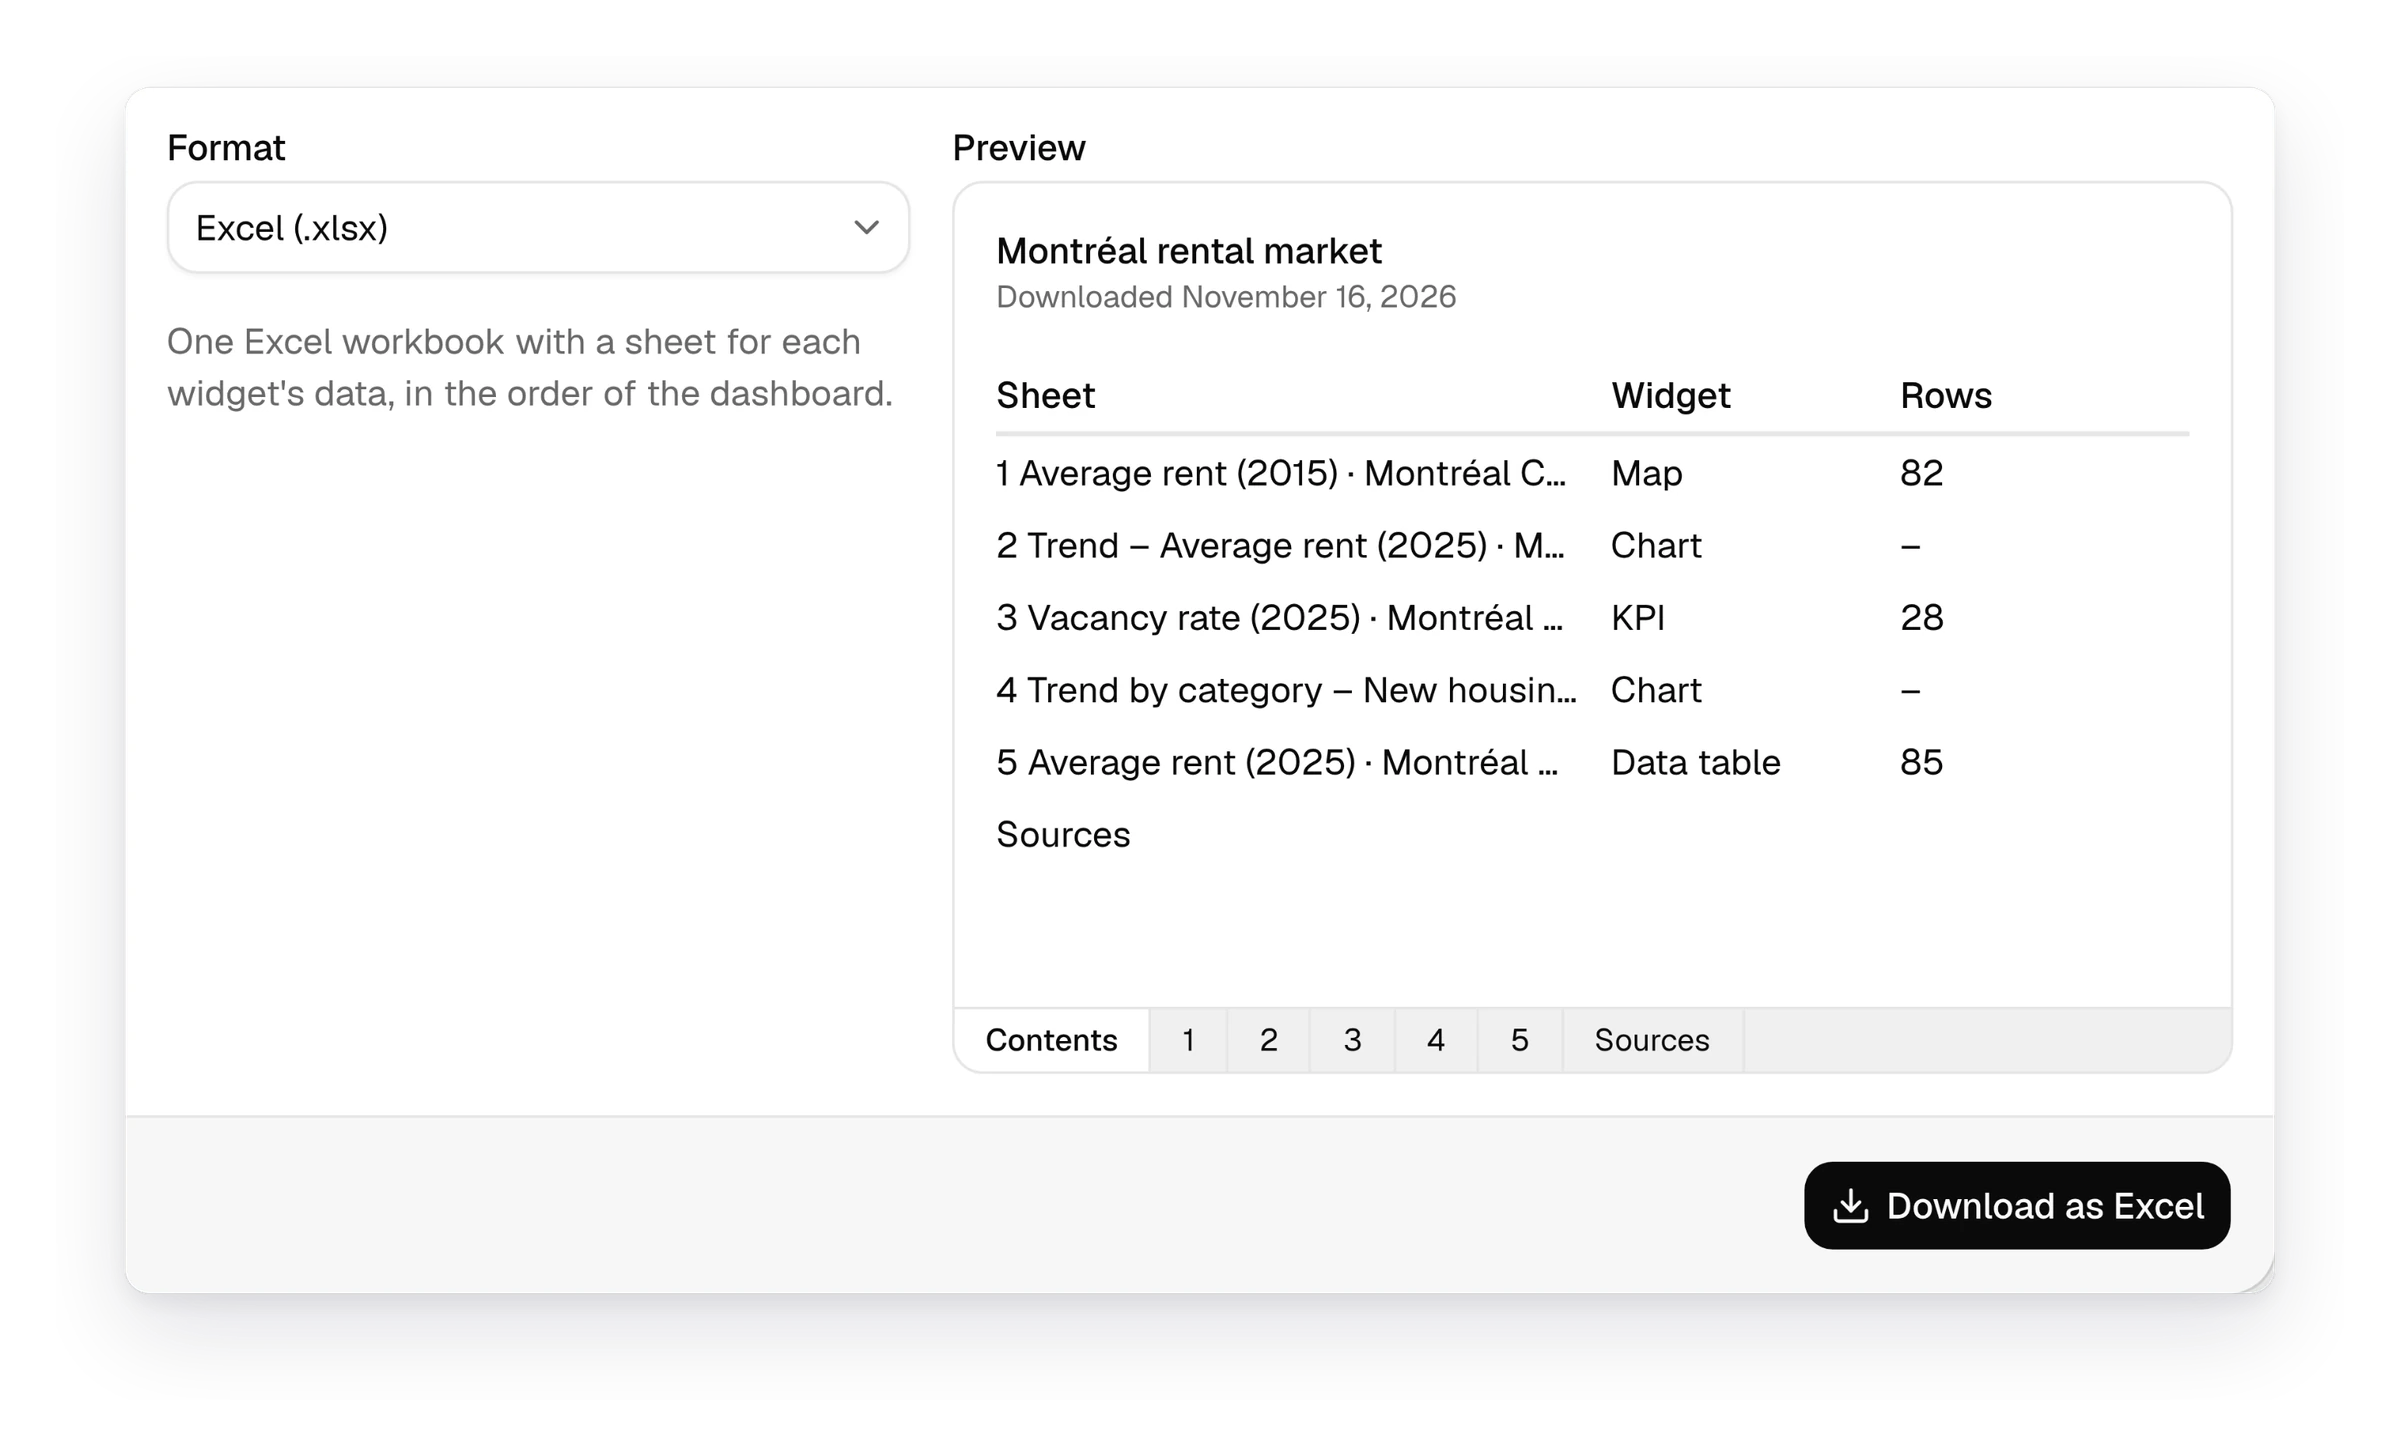
Download a dashboard as an Excel workbook
Click "Share", open "Export" and choose "Excel (.xlsx)" under "Format". The dashboard downloads as one workbook with a sheet for each widget, in the grid's order. Each map or table gets a sheet with every row at the widget's scale, and each chart gets a sheet with the numbers it draws. The workbook opens on a contents sheet that links to every sheet and ends with a sheet of sources. Before you click "Download as Excel," the preview lists every sheet, with a tab showing each sheet's first rows. Documents download the same way, with one sheet per figure, and visitors to a published project can download them too. A workbook holds up to 100,000 rows.
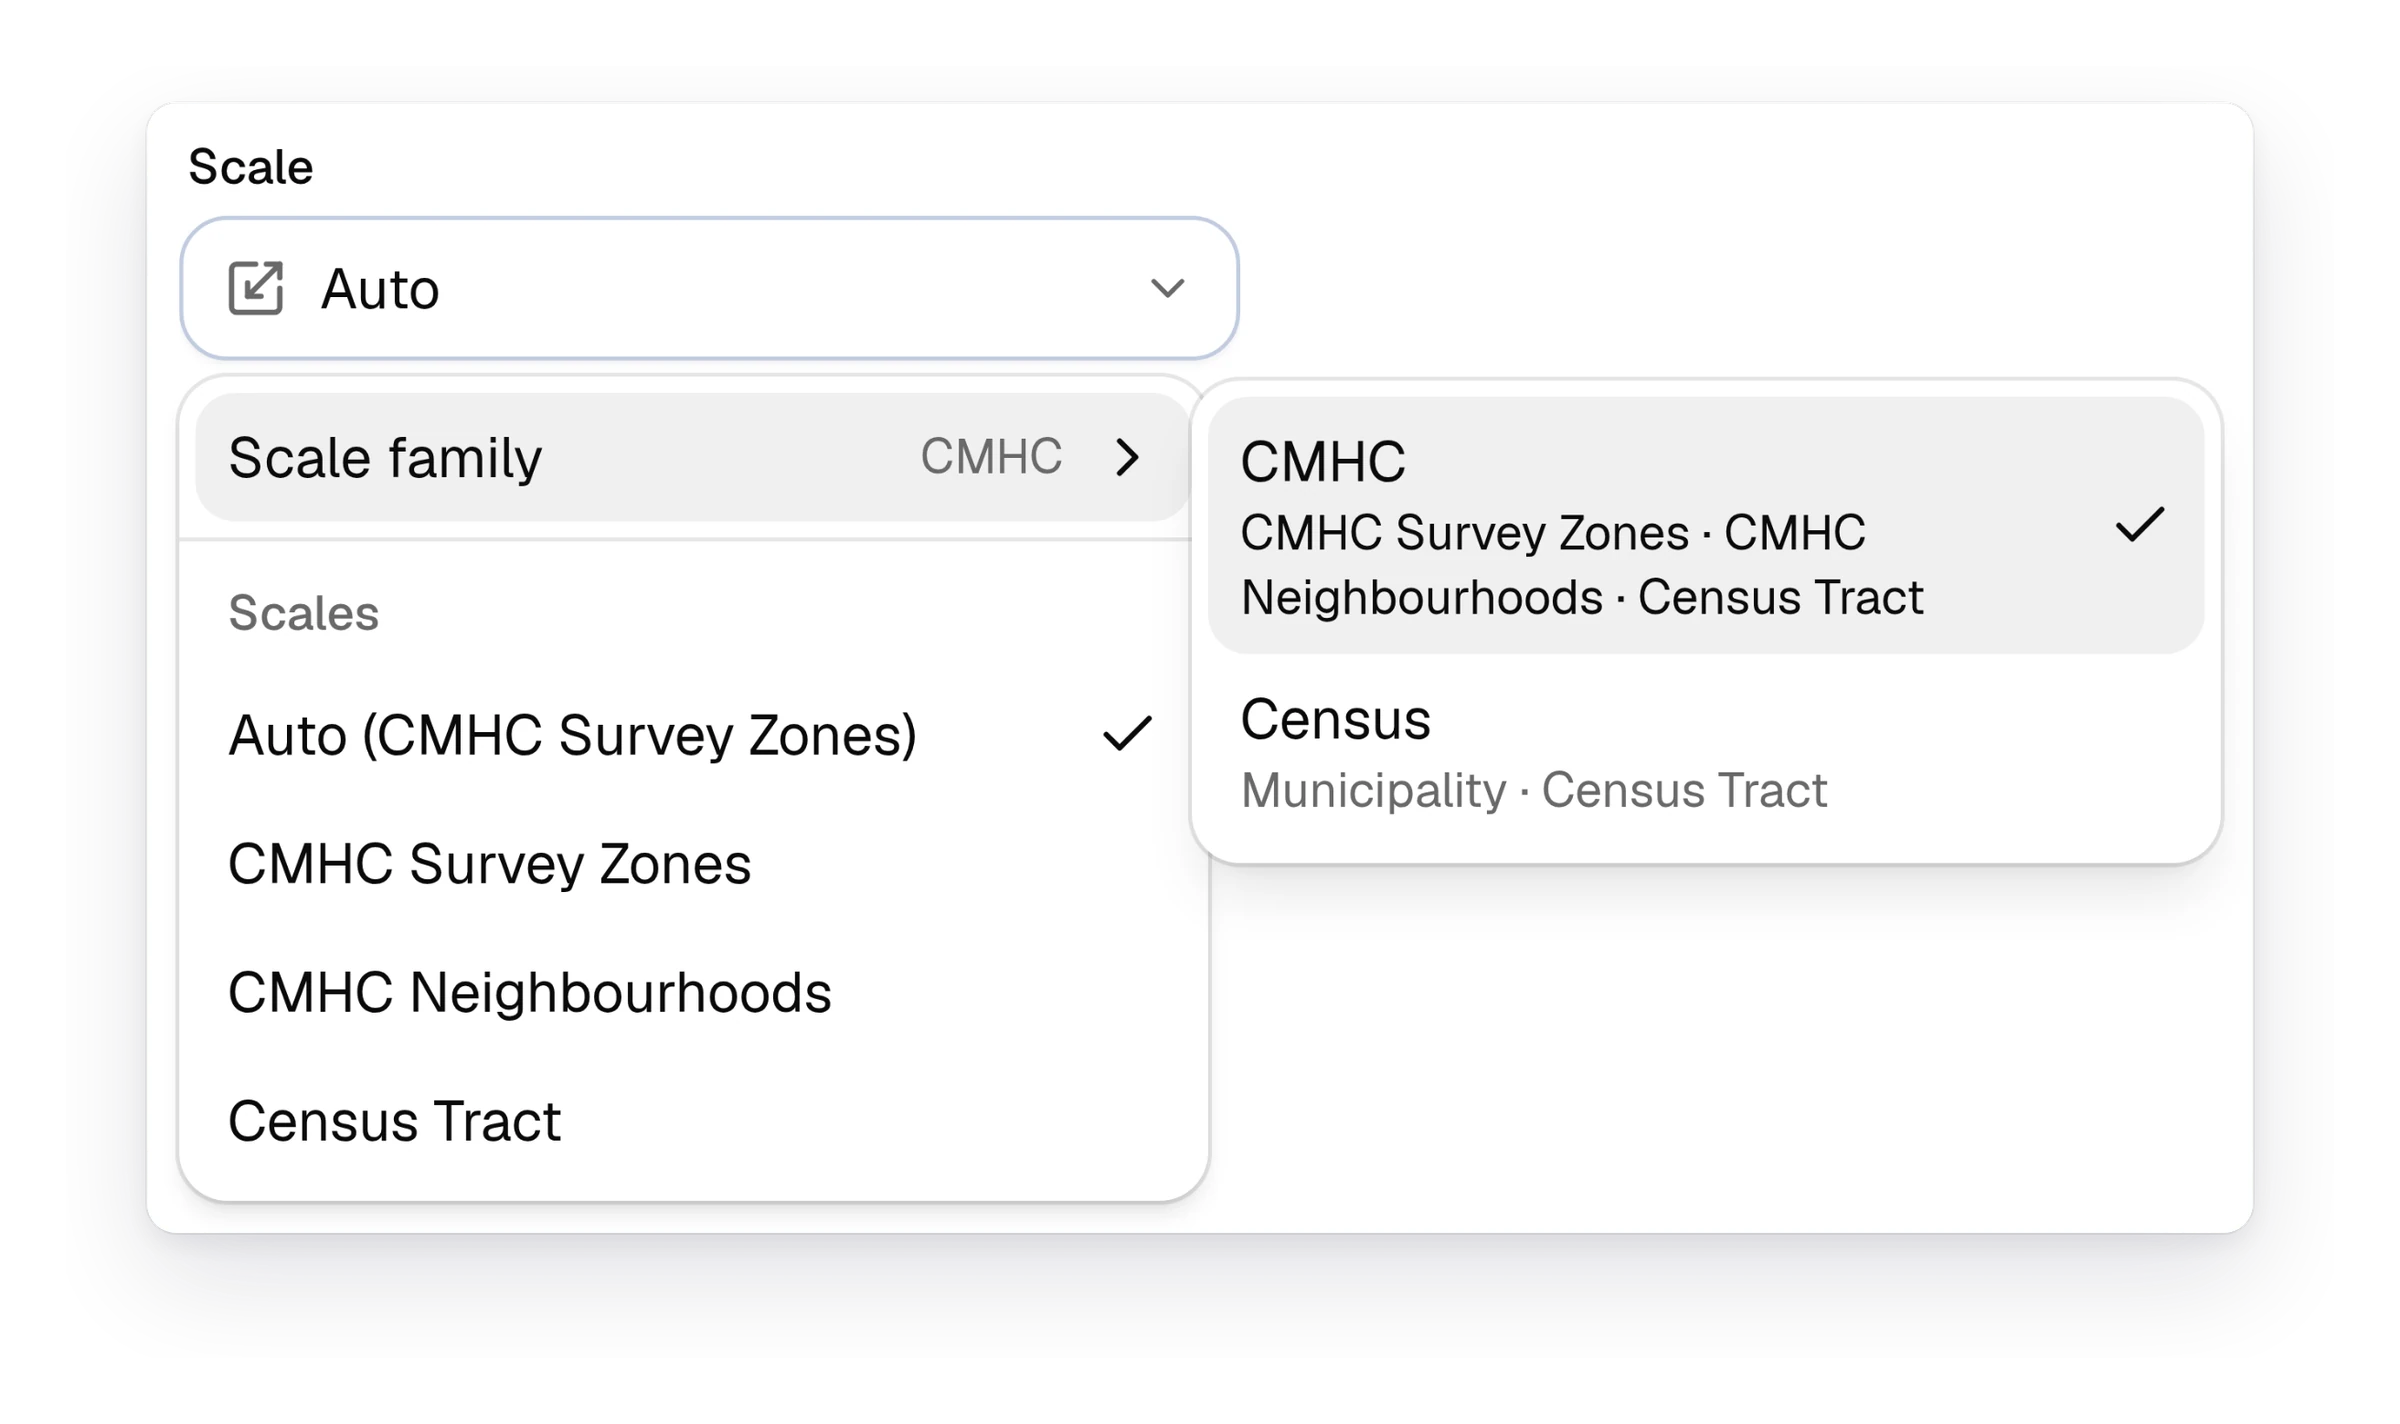
Map CMHC survey zones and neighbourhoods
CMHC publishes its rental market data by survey zone and by neighbourhood. You can now map it at those scales. On an indicator page, open the "Scale" menu and point to "Scale family" at the top. Choose "CMHC". The scales listed under it change to "CMHC Survey Zones", "CMHC Neighbourhoods" and "Census Tract". Choose "Census" to go back to municipalities. CMHC is offered in regions where its scales have data. An organization owner can choose which scale family maps open on under Settings › General › Default scale family. Each project can override this in its own settings.
See how Curbcut Studio fits your next project.
Book a demoNew1
- AccountsCurbcut Studio accounts start from an invitation, and Curbcut sets up each organization's plan
Fixes18
- PagesScreen readers name the indicator page's controls, and table rows work from the keyboard
- PagesScreen readers read each chart as a table, and every page has a skip link
- PagesScreen readers read chart values, slash menu options and page actions
- PagesThe workspace keeps its desktop layout at 200% browser text size
- PagesIndicator page edits are saved before you switch to another page
- PagesLong page lists scroll in the pages menu and in "Change source…"
- ChartsEvery distribution chart marks the area selected on the map
- ChartsHistograms draw on a logarithmic axis even when a bin is empty
- ChartsTrend charts are unavailable when an indicator has a single period
- ChartsBar charts give their bars more room in short cards
- ChartsThe arrow keys move from bar to bar on bar charts
- ChartsPale bars, points and legend swatches have an outline that stands out on white
- MapsCanada-wide maps open with the whole country in view
- MapsLong popup values and legend ranges wrap instead of being cut off
- DashboardsKPI figures show in full in narrow tiles at large text sizes
- AssistantLong reports with maps and charts no longer break the Curbcut Assistant's chat
- AssistantTables the Curbcut Assistant writes in documents come out as lists or live tables
- AccountsConfirming your email at sign-up shows an error instead of hanging