From planning question to answer
in a few clicks.
Curbcut Studio gives planning teams instant, self-serve access to hundreds of spatial indicators, no GIS expertise required. Explore, analyze, and communicate insights at the speed your work demands.
English and French. Hosted in Canada.
 Residents 65 and over in Rimouski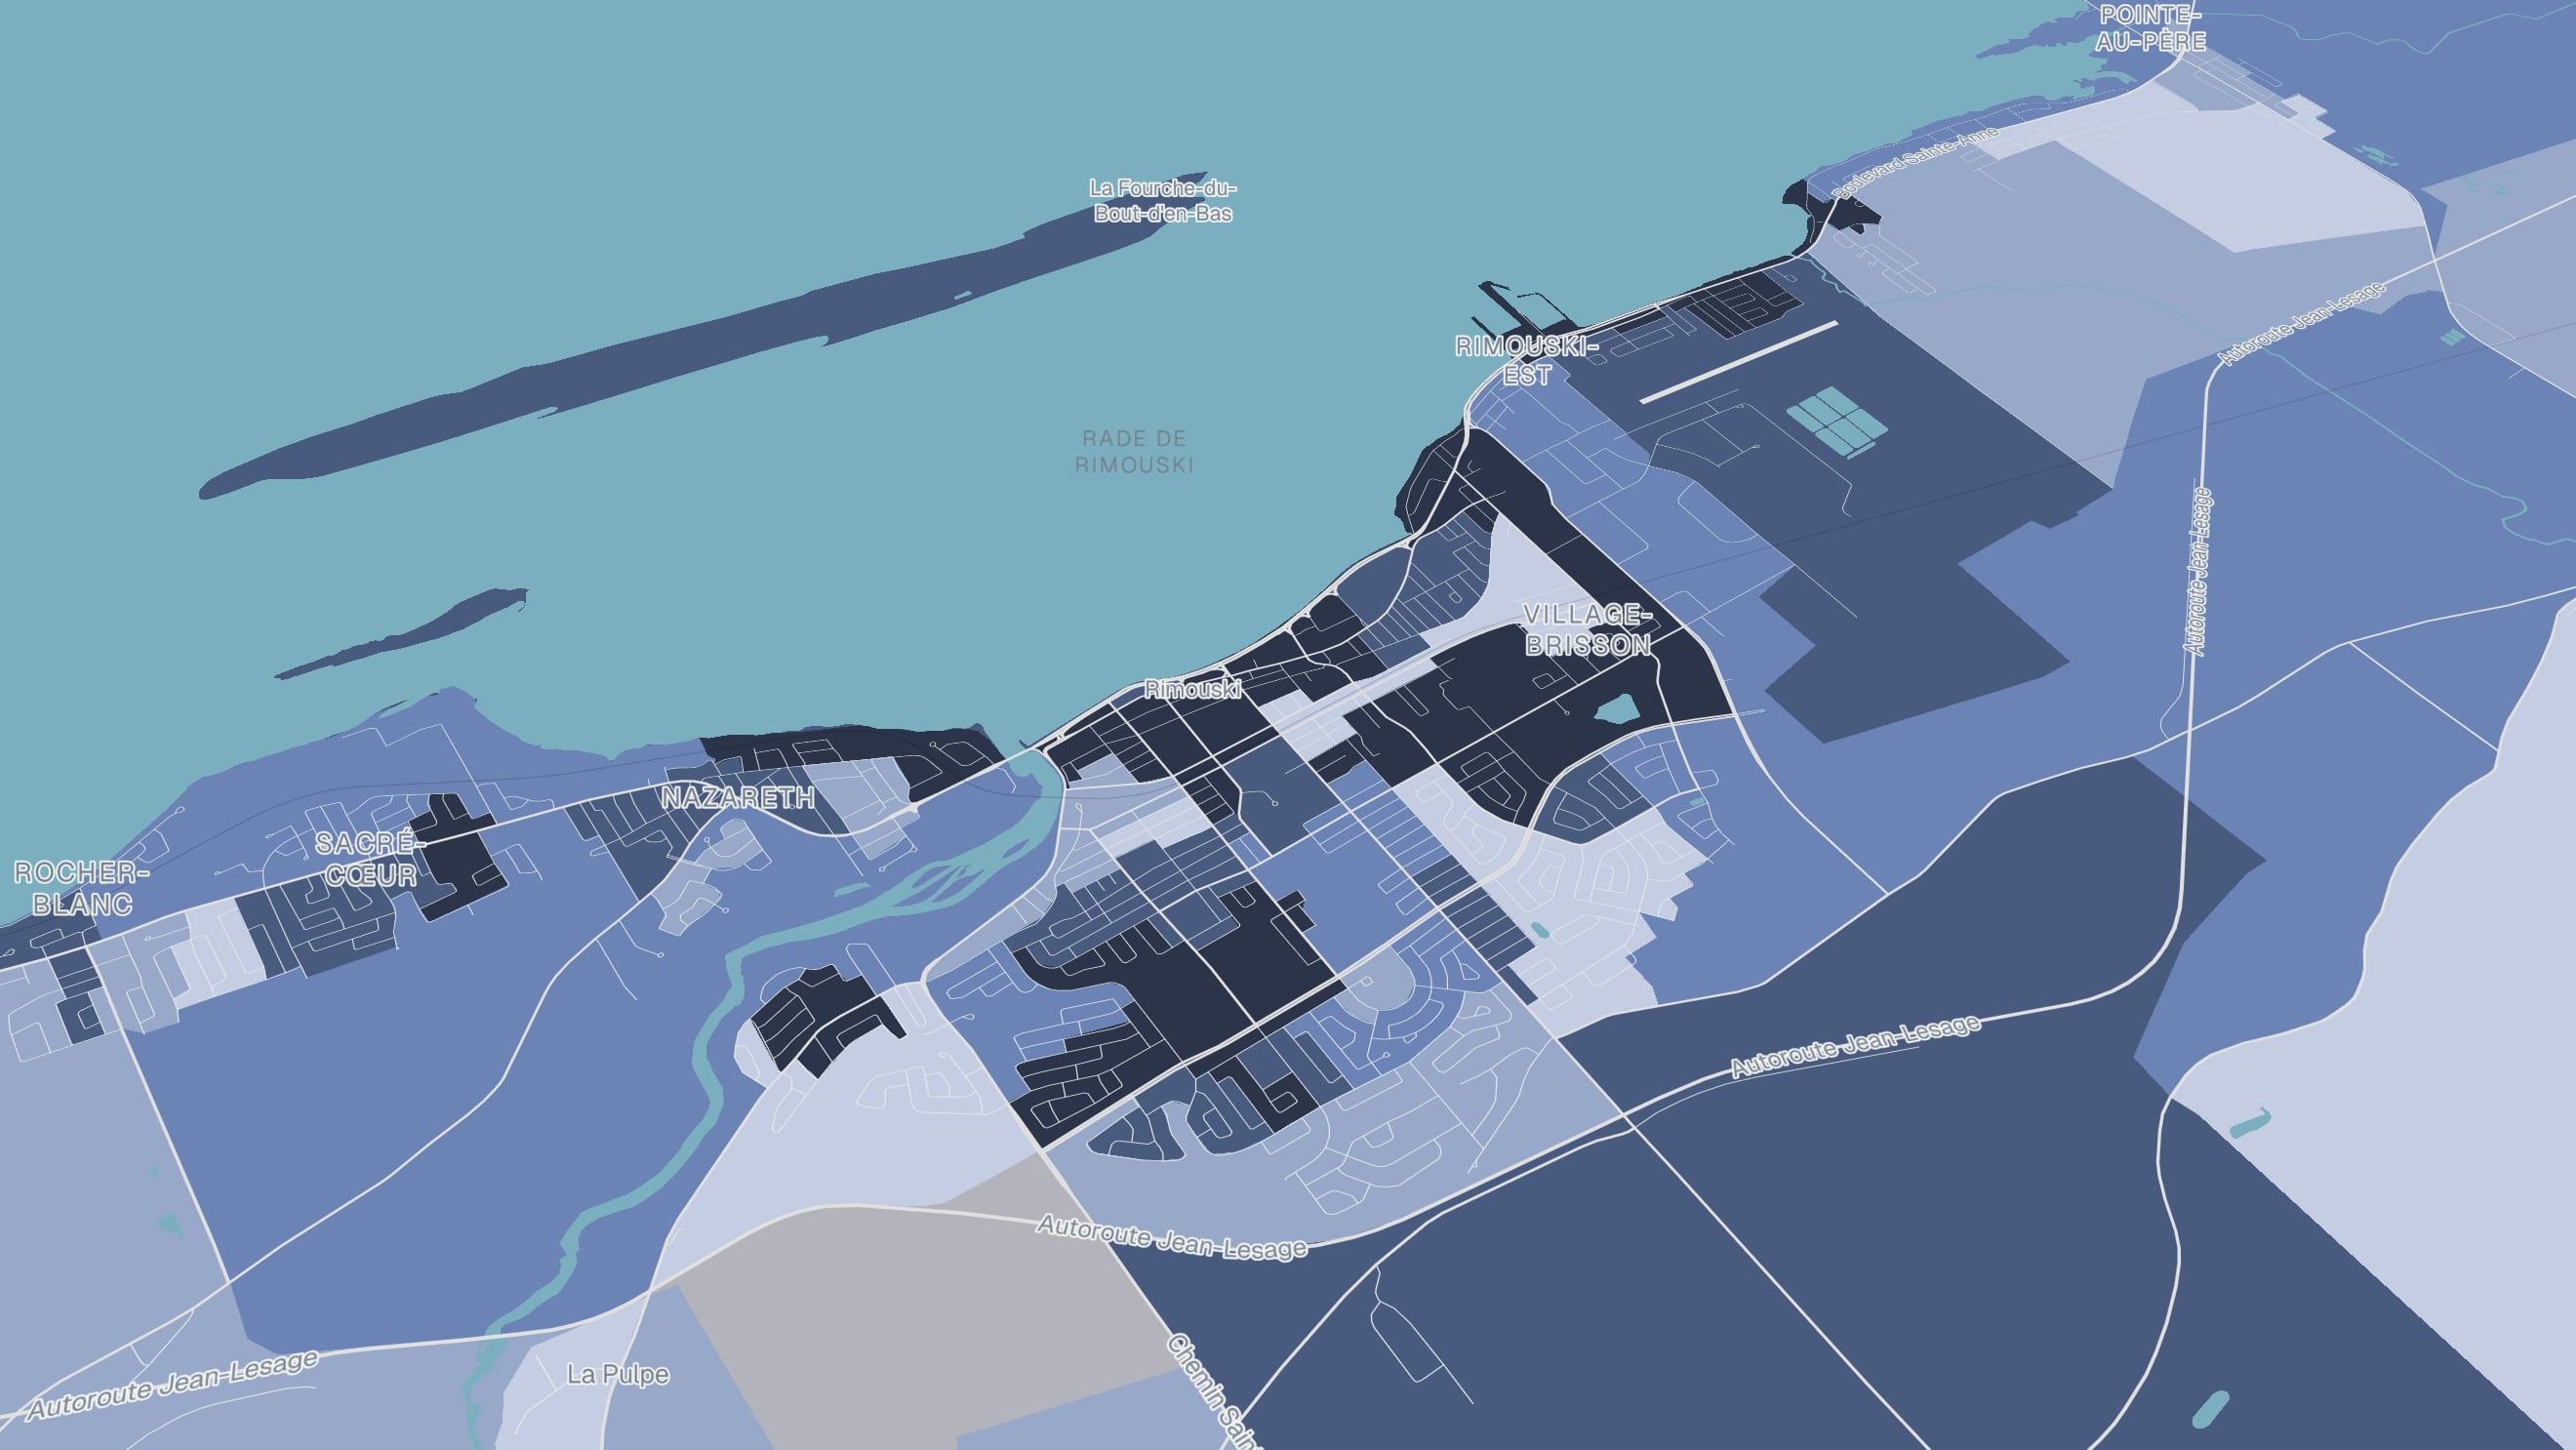
- Housing, Infrastructure and Communities Canada
- B.C. Ministry of Housing and Municipal Affairs
- City of Laval
- PRDS de Laval
- Centraide du Grand Montréal
- United Way Greater Toronto
- Mobilizing Justice
- NSERC RESNET








Every map here is a stack.
An answer is not one dataset. It is a basemap, an indicator, and whatever else the question needs, drawn on the same geography so they can be read together. Take this one apart:
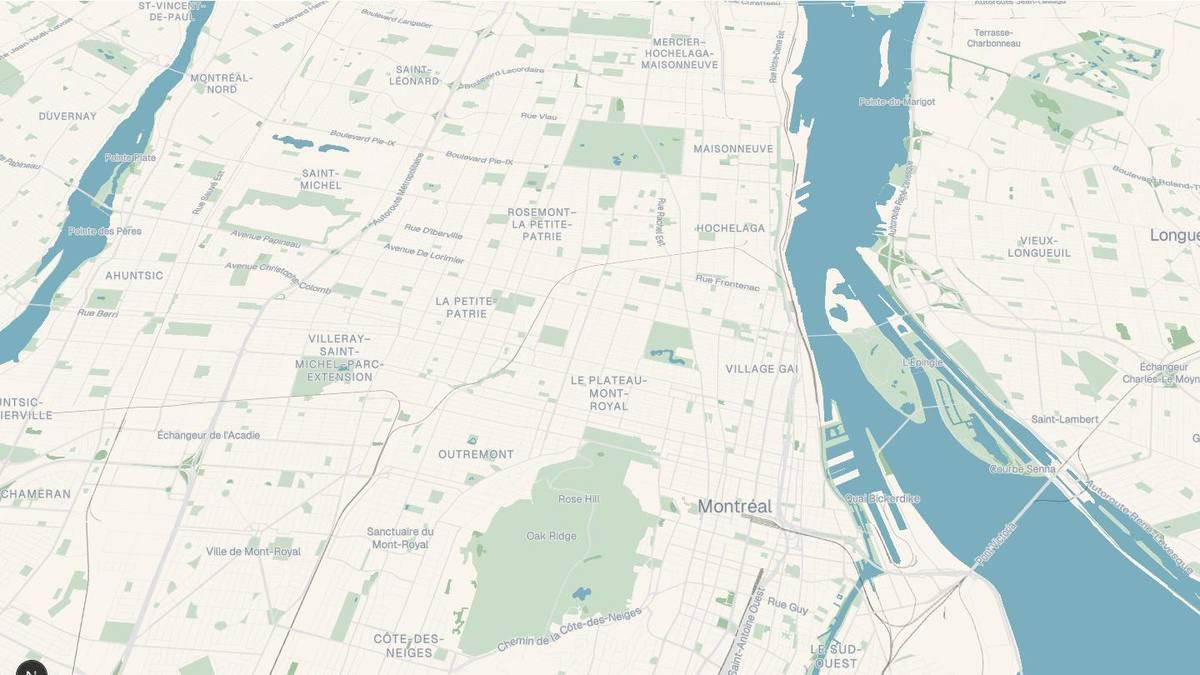
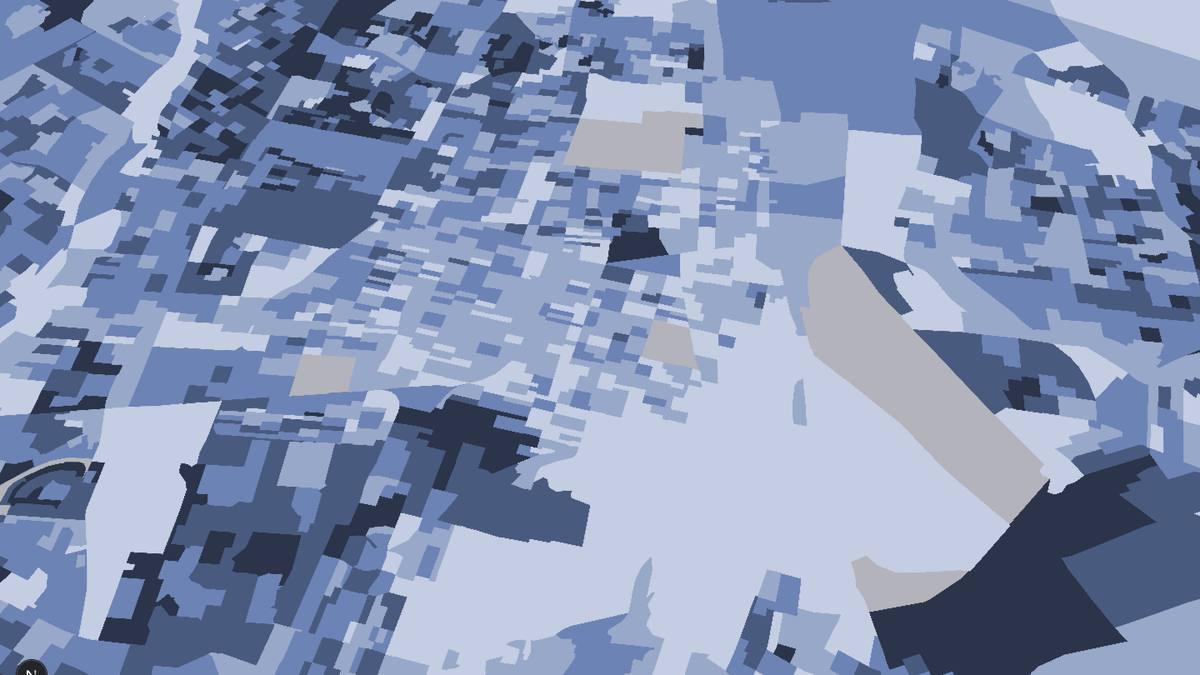
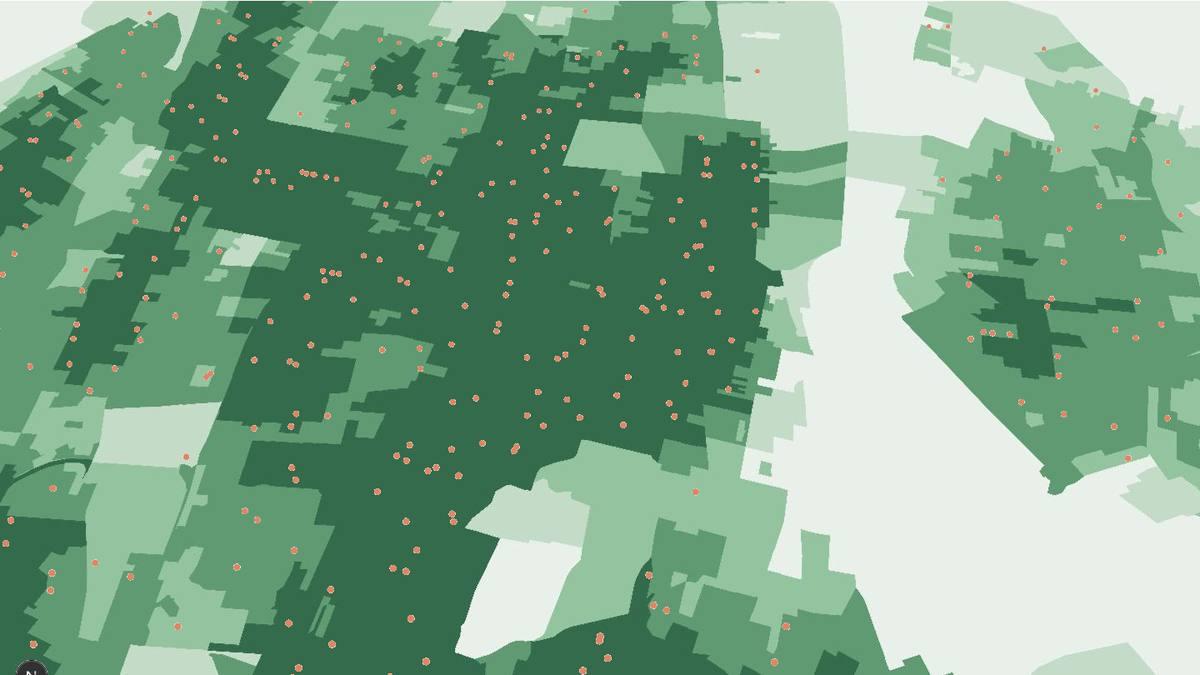
Hundreds of indicators, already on the map.
Every indicator is ready to draw at any scale, from a few blocks to a whole metropolitan region, for each census year, with its source attached. Pick one and it is on the map.
Built on Statistics Canada · CMHC · Institut de la statistique du Québec · Provincial open data portals · Satellite imagery · OpenStreetMap · Your own data
- Tree canopy (high vegetation)
- Active living potential
- Median household income
- Access to any rapid transit mode
- Population density
An assistant that drives the map, and shows its work.
Ask in plain language. The assistant searches the library, changes the indicator, region, scale or year, queries the data and answers. Every change it makes is listed, and one click undoes it.
- Searching indicators
- Changing indicator
- Comparing two census years
- Querying data
Québec City gained about 17,500 renter households between 2016 and 2021: renters went from 39.8% to 41.7% of all households. The map shows which blocks drove it.
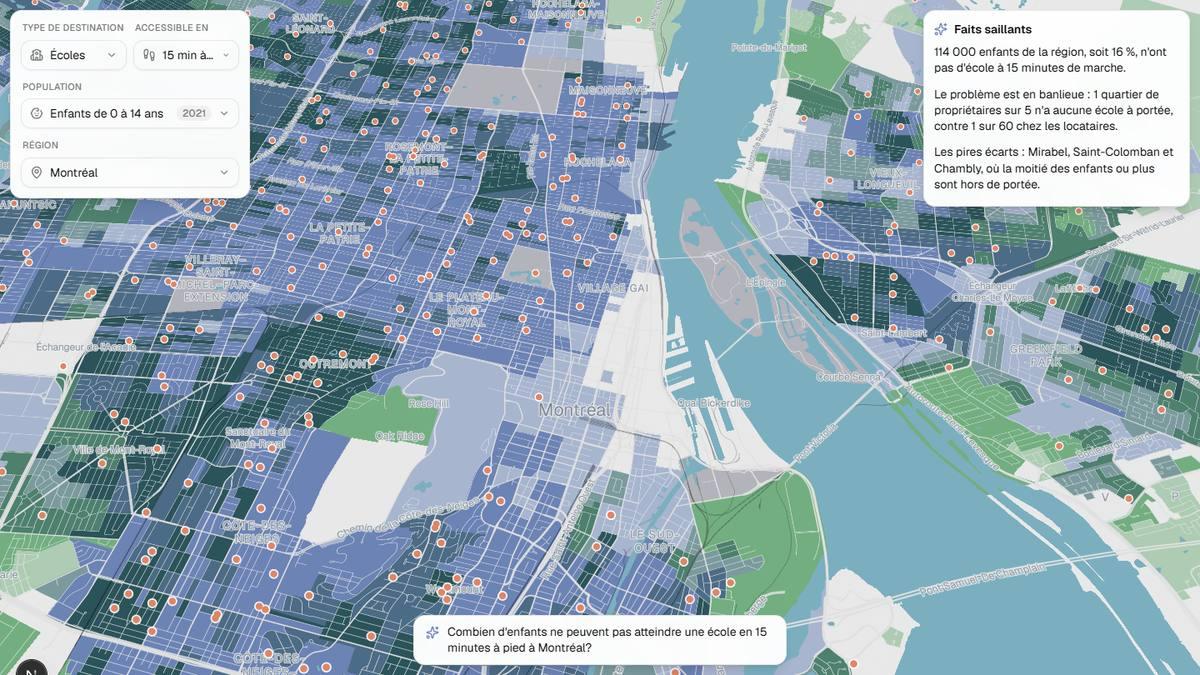
Who can't get there on foot?
Studio carries travel-time matrices for every neighbourhood, on foot, by bike and by car. Pick a destination type, a mode and a time limit, and it works out who can reach it. Then compare with any indicator, so the question is never just where the schools are, but who lives out of reach of one.
- Which seniors in Québec City live more than 20 minutes from a pharmacy?
- How many children can't reach a school within 15 minutes on foot in Rimouski?
- Who can't reach a second grocery store within 15 minutes in Montréal?
Your data, next to Curbcut's.
Drop in a spreadsheet of your own: building permits by neighbourhood, service requests by district, program uptake by municipality. Studio matches it to the map and it becomes an indicator like any other. Map it, compare it with renter share or population density, filter on it, publish it.
- Upload
- 2Geography
- 3Review
Write the full report where the data lives.
Not a caption beside a map: a complete report. Headings, sections, images, and any indicator dropped in as a map, a chart or a table, all reading the same live data. The assistant reads and edits the document with you. Publish to your organisation's own address, export to PDF or Word, or send a live link. Bilingual from one project.
The unglamorous details, handled.
- Languages
- English and French, per user and per project.
- Workspaces
- Organisations, roles, invitations, enterprise SSO.
- Publishing
- yourcity.studio.curbcut.ca, public, no login.
- Exports
- PDF, Word and PNG, maps at print resolution.
- Analysis
- Compare two indicators, filter, switch scale, read the table.
- Hosting
- AWS Canada (Montréal region), encrypted in transit and at rest.
Shipped continuously, written up every week.
- New · 2026-09-28Embed a widget from an indicator page
- New · 2026-09-28Allow pages to be hidden
- New · 2026-09-28First batch of graphs with per-chart settings
Questions planners ask us
Bring a real question.
The trial is the full product, not a sandbox: every dataset, every region, and your own files alongside them. Start with something you actually need answered.