
Dashboards
Dashboards are a new kind of page in Curbcut Studio. A dashboard puts maps and charts from several of your indicator pages side by side on one grid. You can publish it as a link that your stakeholders can open in their browser.
Build a dashboard
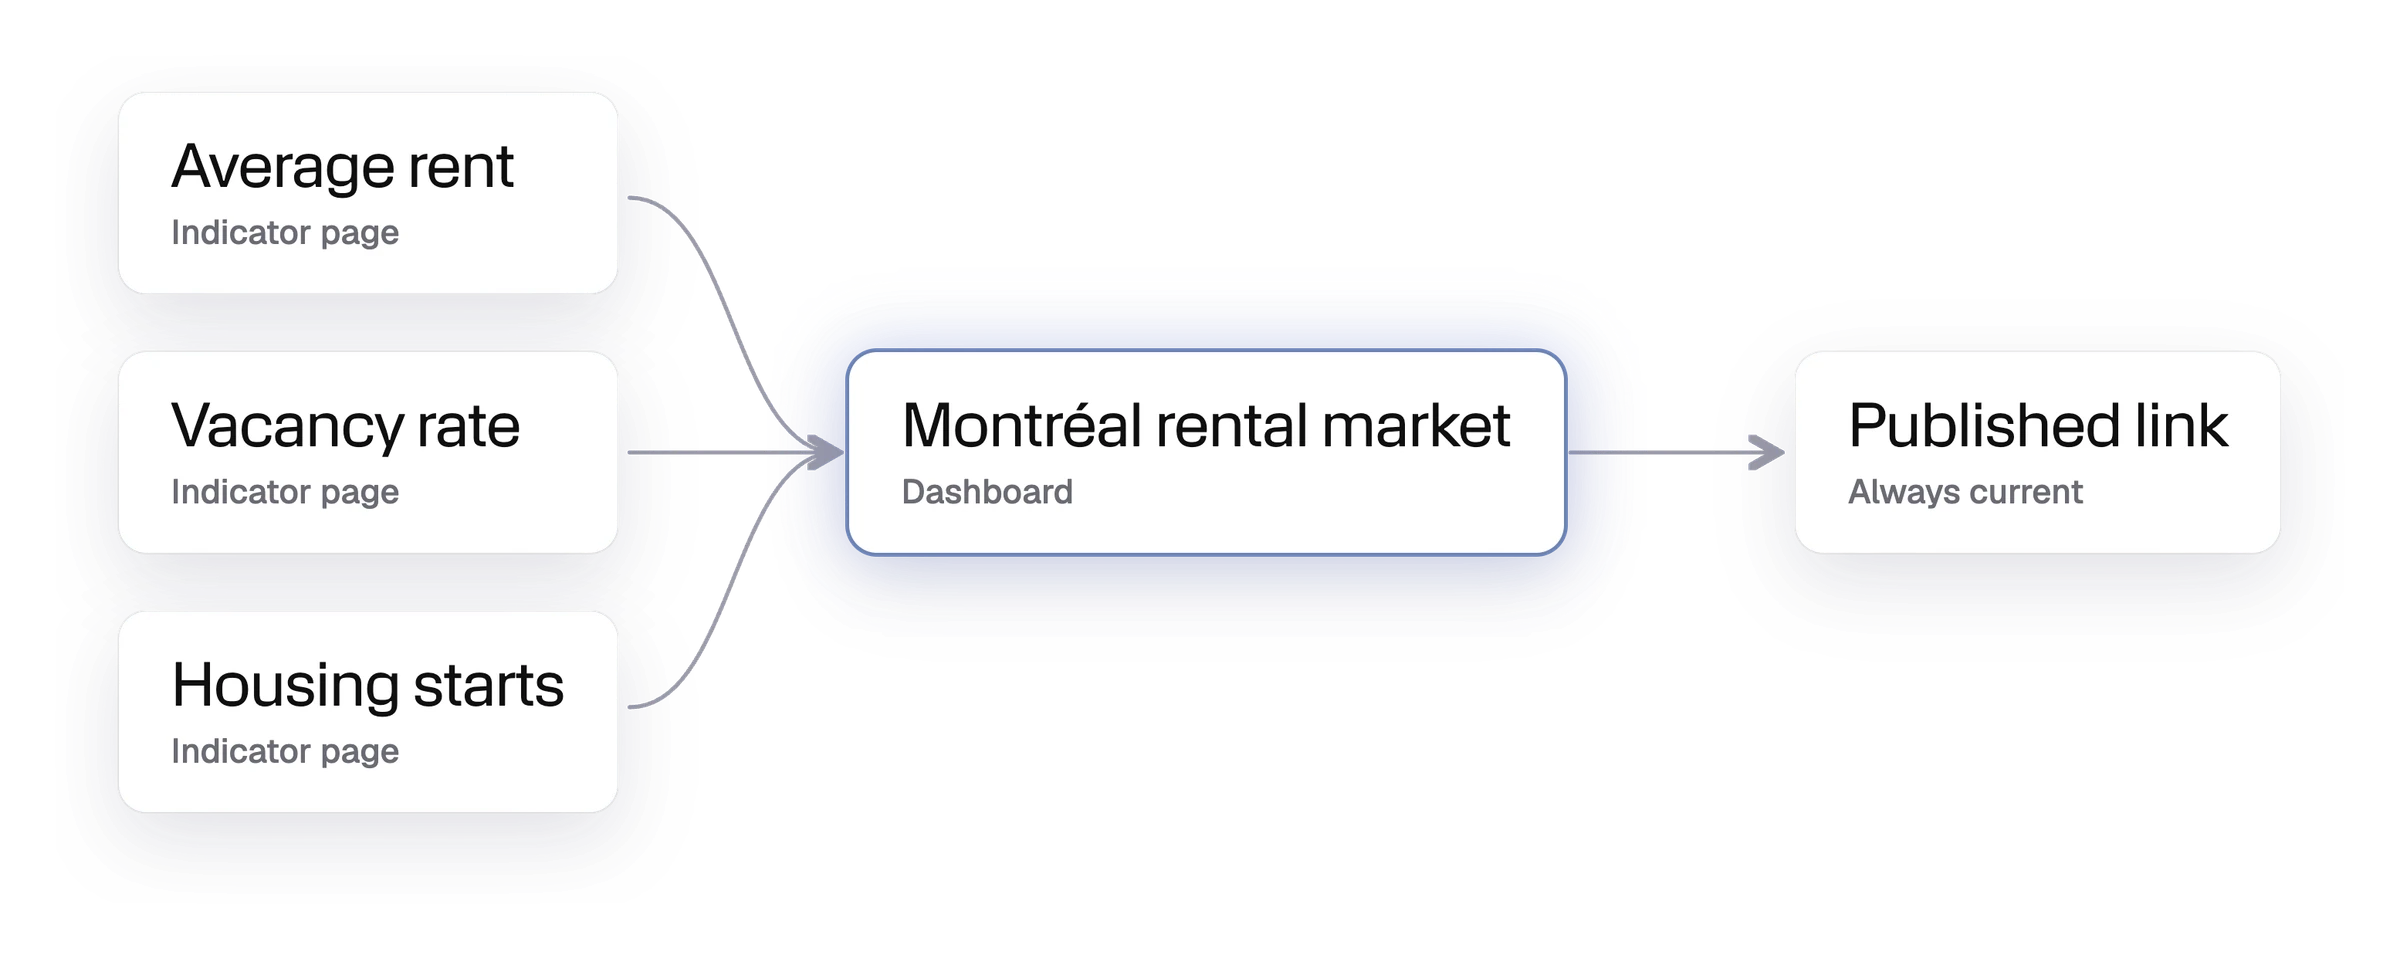
Create a dashboard from "New page" and fill it with widgets from any of your indicator pages. For a housing needs assessment, you might put the map of average rent beside its trend, and vacancy by bedroom type beside housing starts. Click an empty space to add a widget there. Drag a widget by its grip to move it. To resize widgets, drag an edge or the gap between two of them.
Widgets stay connected to their page
A widget on a dashboard stays connected to the indicator page it came from. If you change that page's indicator or region, every dashboard that uses it updates. So does the published link. City council, a client or your partners see the same figures you do.
Charts sorted by shape
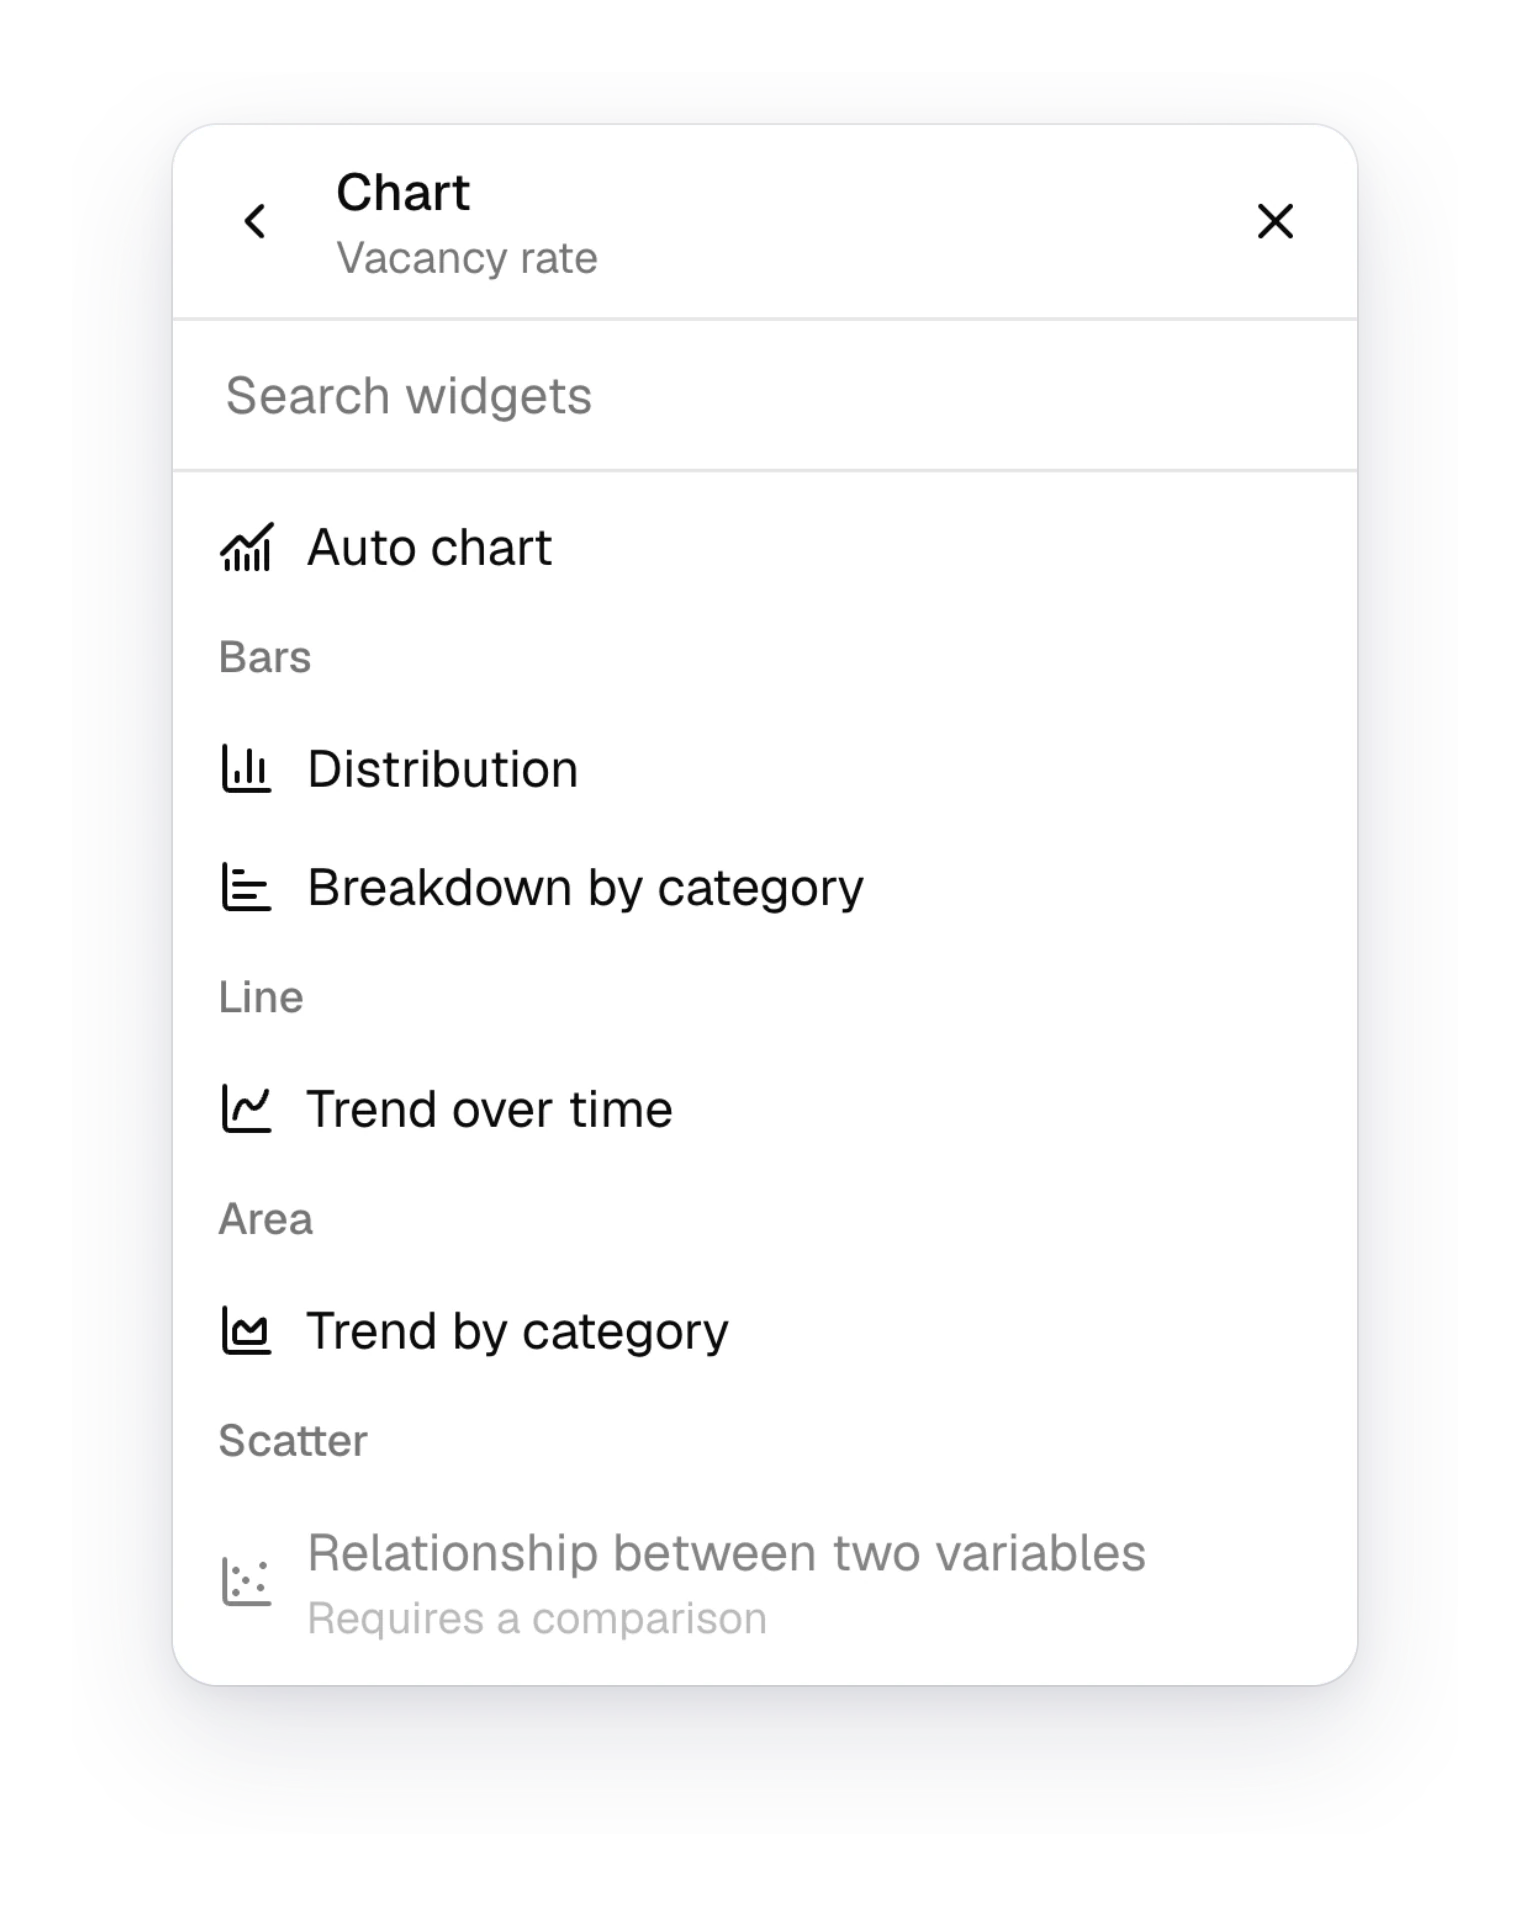
When you add a chart, the list now sorts the indicator's charts by how they look. For vacancy rate, "Bars" holds the distribution across municipalities and the breakdown by bedroom type, "Line" holds the trend over time, and "Area" the trend by category. A chart that the page can't show yet stays in the list, greyed out, with the reason listed. A scatter plot, for example, needs a second indicator to compare with. "Auto chart" follows the page's main chart.
See how Curbcut Studio fits your next project.
Book a demoNew1
- BillingA payment card is now required to start a free trial
Fixes2
- AssistantThe assistant follows the project's indicator selection
- TablesColumn headers are translated in French
Improvements1
- IndicatorsThe glossary loads when opened, not on every page load