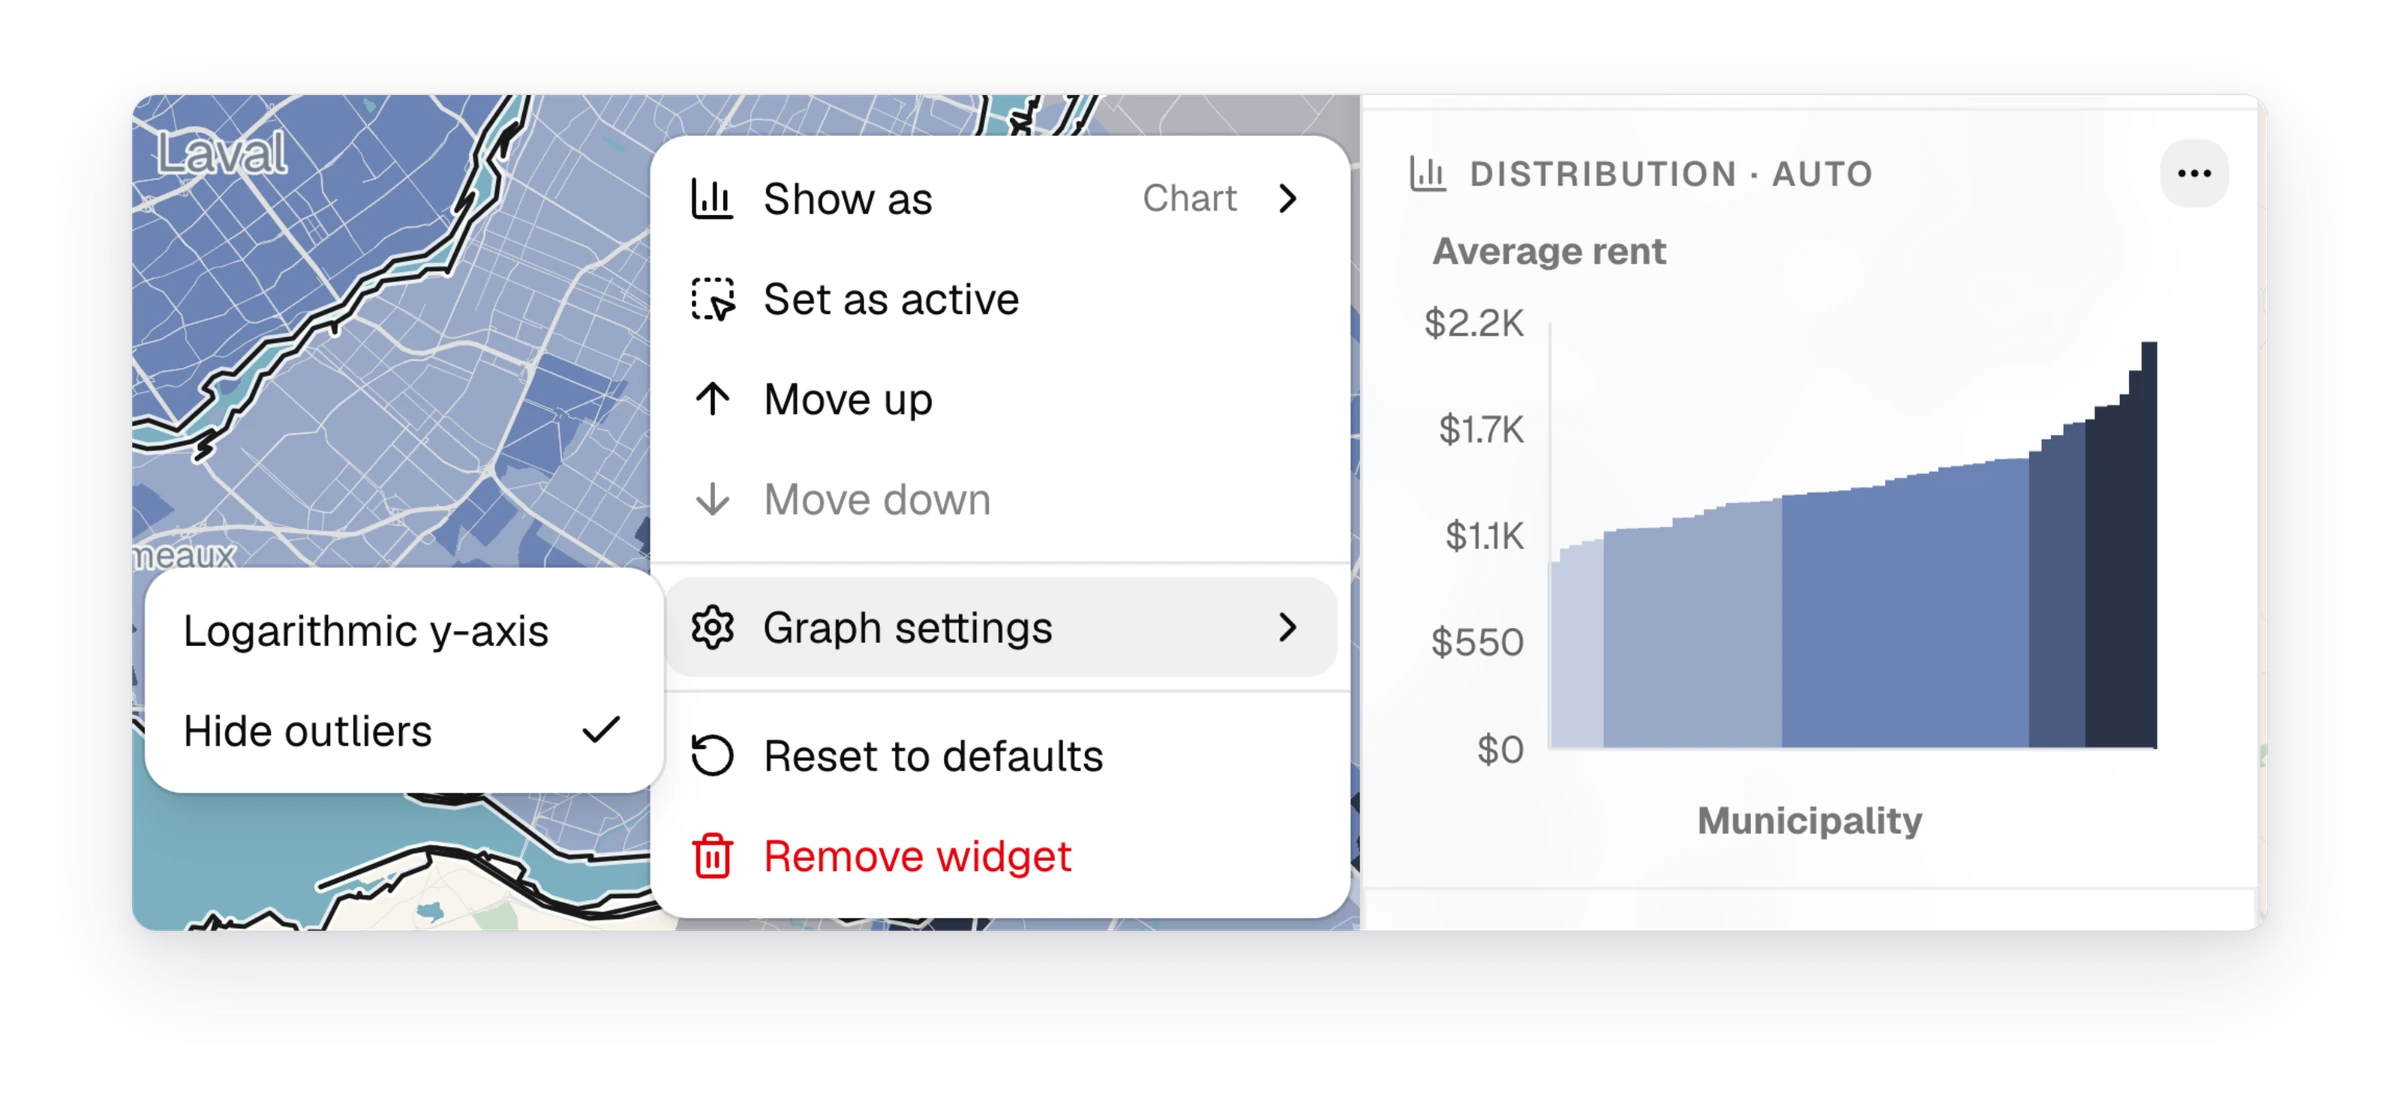
Charts are now widgets, like the map and the table. Add one to an indicator page and set it up from its "…" menu. Everyone who opens the project sees it the way you left it.
Settings for each chart
Under "Graph settings" in a chart widget's "…" menu, you can switch to a logarithmic axis, hide outliers or limit the range of years. The settings are saved with the page. If changing the page's indicator would leave a chart with nothing to show, Curbcut Studio asks before making the change.
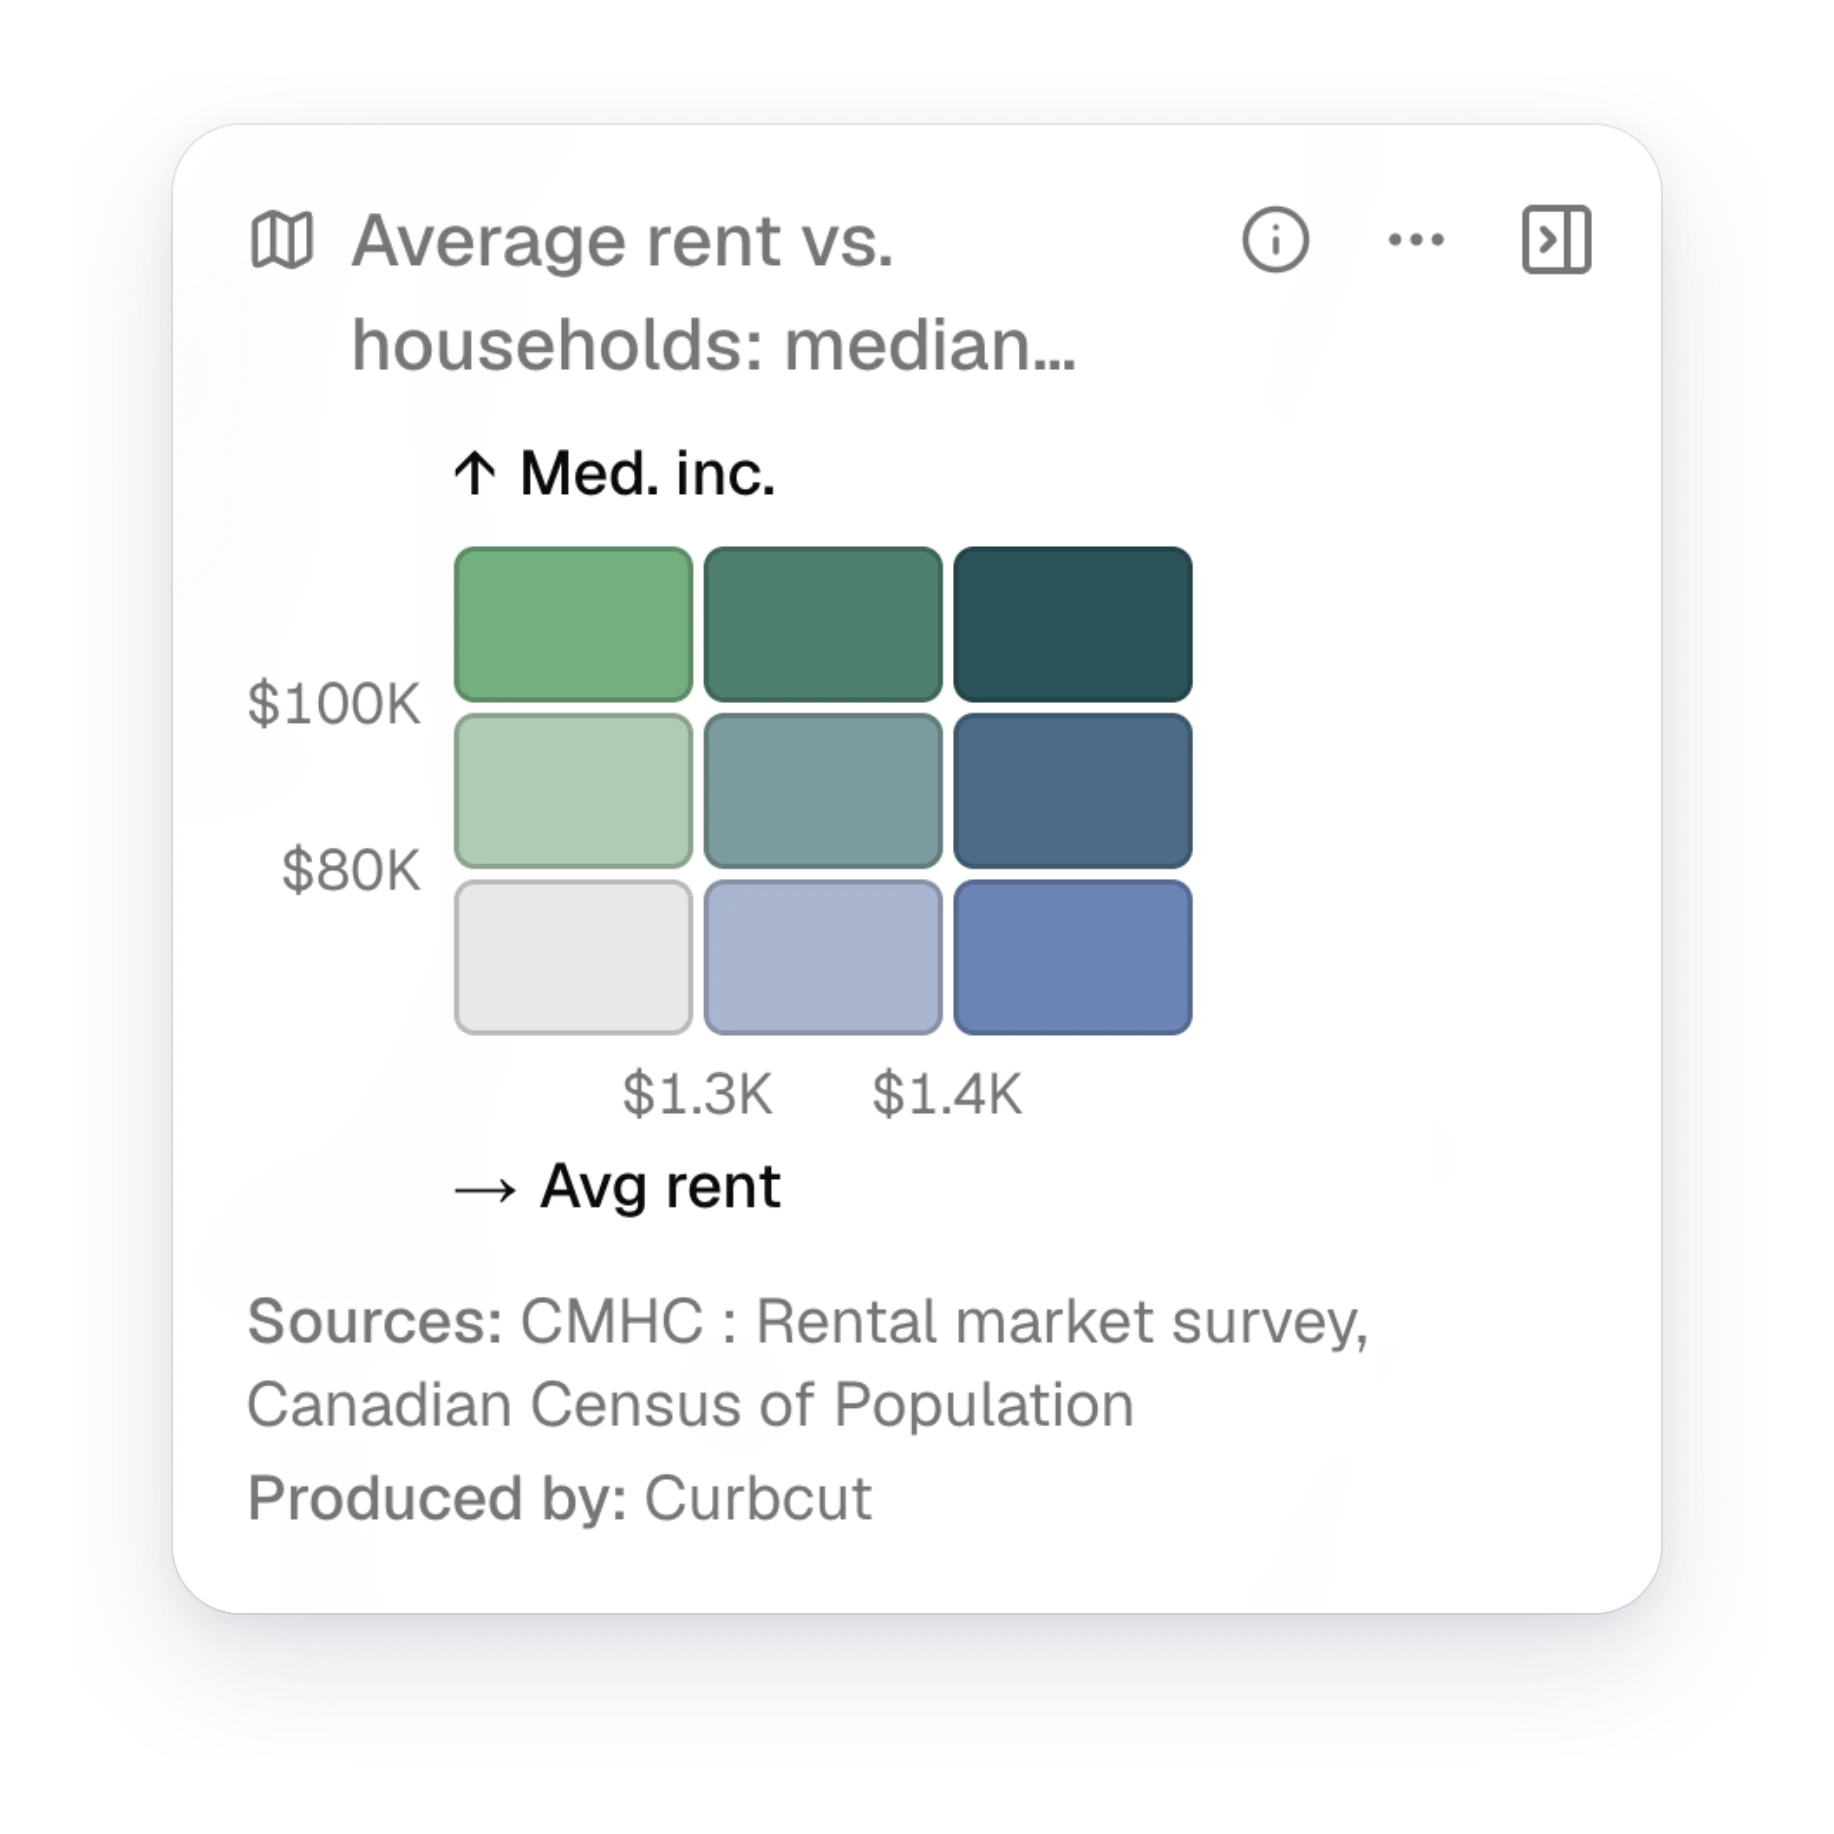
A clearer legend for two indicators
When you compare two indicators, the legend is now a three-by-three grid with an axis for each indicator and the values where its colours change. It fits in the side panel and stays readable when the map is printed.
New4
ChartsDistributions name each place's bar up to 15 places, and become histograms beyond 100
DocumentsDocuments embed any widget, and can create the page it comes from
PagesA page can be hidden from a published project's readers without being deleted
AssistantThe Curbcut Assistant can add, remove and set up widgets; each change can be undone
Fixes10
IndicatorsThe selected year stays when you switch indicators or breakdowns
ChartsCharts work for accessibility indicators and follow the map's settings
PublishingCustom indicators and category icons show on published pages
PublishingLink previews of published pages with charts work again
PagesCurbcut Studio no longer breaks when the browser translates the page
MapsTooltips set place and indicator names in bold instead of quotes
PagesMoving between pages no longer flashes the Curbcut Studio home page
DocumentsDocuments load more reliably
Accounts12-character passwords, email-only recovery, and removing a member revokes their project access
WebsiteThe homepage reads in natural Canadian French